Saturday, January 28, 2017

The End of Oil Part 7


The End of Oil Part 7
In this post I will attempt to explain in more detail the methodology of the Hills Group  in their 65 page paper issued as a second version in March 2015 entitled “Depletion: A Determination for the world’s petroleum reserve An exergy analysis employing the Etp model.
Fair warning: the interpretation and explanations are mine and mine alone and they may be inaccurate, wrong or confusing. I come from a scientific background and took advanced chemistry, physics, biology and calculus level math but I struggled to understand portions of this paper and had to refresh long forgotten concepts in thermodynamics. If I am uncertain of my understanding I will so state.
I will give the abstract to their report……..
ABSTRACT:
Petroleum is a primary energy source; its other uses have only minor commercial value. It therefore follows that to be an energy source petroleum must be capable of providing sufficient energy to support its own production system (extraction, processing and distribution). Thus, the total specific (per unit) energy needed to complete the process cannot exceed its own specific exergy. Entropy production (a Second Law mandate) in the petroleum production system (PPS) requires that a point will to be reached when the production energy required to drive the process forward becomes equal to its specific exergy. It can be shown that this breakeven point for petroleum production occurs when the cumulative production curve approaches its top abscissa. This point represents the maximum theoretical volume of petroleum that can ever be extracted for use as an energy source. The total production energy (ETP) is therefore a function of the cumulative production function (CPF) and the entropy production of the PPS. The entropy production of the PPS is derived through the solution of the Entropy Rate Balance Equation for Control Volumes. The ETP function generated is an accurate predictor of historic and future petroleum prices, production, and the depletion status of the world's petroleum reserve.

M King Hubbert who first predicted depletion of the world’s reserve made a prescient statement and is taken from a new book “The Oracle of Oil(2016):
So long as oil is used as a source of energy, when the energy cost of recovering a barrel of oil becomes greater than the energy content of the oil, production will cease no matter what the monetary price.”
  I will attempt to simplify the key methods used by Hill et al and use a few definitions as possible.
   I have previously stated in an earlier blog some of the world Resource estimates which are not  reserve estimates. A reserve is a known quantity that can be economically extracted. A resource  is an estimate based on educated guesses, proximity to active producing fields, perhaps preliminary seismography fields, similar geology and so forth. Both resource and reserve terms have many sub headings which I will not go into here. The USGS in 2000 gave a world resource base of 4300 Gigabarrels(4.3 trillion barrels.)  The world to date (2016) has consumed 1.29 trillion barrels. The Hills group decided at the outset that they could use only verifiable data sets and not company or country figures and they chose world production of conventional oil starting in 1900 through 2009 which was obtained from the EIA along with the price history. They attempted to analyze then entire production process such as extraction, processing and distribution. It is not stated in the paper how this was achieved or obtained and what factors were included or omitted. Nevertheless they determined as best as possible how much energy was used per year and called it Etp, total production energy.. Obviously this figure had to be less than the specific Gross Exergy which is given by the unburned virgin energy of a specific variety of crude API 30-45 deg. Which is 140,000 btu/gal. They call this quantity exergy, not energy which I believe is incorrect. Exergy is energy available to do work and no work is available to be performed until oil is burned . After it is burned 29% is given off as waste heat which generally (but not always) is lost as exergy, which leaves 99,400 btu/gal as your exergy, your quantity to do work.
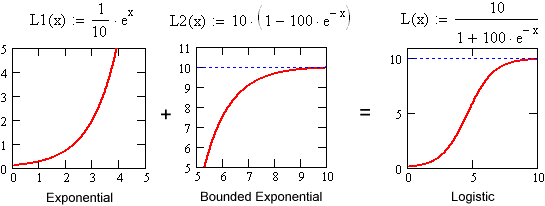
    They then modeled oil production in three control volumes which by definition are open systems allowing mass and energy to be transferred. These control volumes differ from some types of thermodynamic analysis which is structured using isolated or closed systems. This open system is assumed to closely represent an oil reservoir/well head environment. I am unable to reproduce their sketch but it shows a simple diagram with at the bottom the black oil reservoir with a drill pipe passing through the ground to the well head exiting in the Environment, that is reservoir, well head and the environment as three control volumes. The next section shows the calculation of Etp(Total production energy) using a daunting equation which again does not reproduce accurately for me. If I can reproduce these pictures and equations later I will include them in this blog. They are available to view on pages 6 and 7 in their paper. The group then endeavor to simplify using the Entropy Rate Balance Equation for control volumes which seems straight  forward enough as they calculate the entropy production in the Petroleum production system  and in the end they show their calculated value for btu/gallon per 1 billion barrels for premium API 35.7 crude. They determine the flow rate out of an oil reservoir calculating the rate of crude flow and water mass flow which they say is the cumulative distribution function of the production data set. The resulting production function is displayed  as a logistic curve.   A logistic curve is the familiar sigmoid or s shaped curve which is a nifty type of exponential curve combining the standard exponential increasing at an increasing rate curve combined with with a bonded exponential so called. 


The result is a nice s- shaped curve which describes biological systems like population growth and finite resources of certain types.. The logistic curve is the shape of the Etp curve of the Hills Group. Hubbert’s curve(remember Hubbert’s curve?


Hubbert’s curve
is the so called first derivative of Hill’s cumulative production/Time curve.
    
 Hubbert's curve is a Gaussian or bell shaped curve depiction of oil depletion derived from  entirely different ways of predicting oil field depletion than BH Hills work employing thermodynamics but the results are strikingly similar, particularly the above grey curve which is the NET Hubbert curve.  Both curves show in plain sight as plain as the nose on your face that we may be reaching  a crucial point that M King Hubbert said in a quote I listed in an earlier blog. When all  the oil energy used to extract, process and distribute  oil is being consumed by the petroleum industry then it is game, set, match for society as none of that energy is being returned to society as energy or as wealth. Our industrial society is entirely dependent upon that received energy and  matter to advance an energy dependent technology and maintenance of its complex institutions and remove that crutch, that support and all growth and expansion of societal growth and wealth will cease. If you follow Hills curve to when that point will occur, you will see the year as 2031. No one, No One! is  acknowledging or mentioning this possibility although there have been plenty of hints within and without the Oil Industry for many decades. Here a a few quotes gleaned from books I have on hand and the net: "We've embarked on the beginning of the last days of the age of oil"----Mike Bowlin, CEO ARCO, 1999.
"By early in the 21st century, the era of pumping black gold out of the ground to fuel industrial societies will be coming to an end"---Paul Ehrlich(1974)
    
 Is BH Hill's model of oil depletion correct and is it really possible that the end of oil  could be happening as soon as 13 or 14 years hence? I don't know but I cannot find any substantive flaw in his work.  If oil exergy cannot support its extraction then it's my guess that other energy sources will need to be utilized as subsidy but what can we use ? Coal or gas  energy? Electricity?
    Coal and gas are poor substitutes for petroleum and electricity of course is not an energy source anyway. It is just a convenient carrier of energy, which would have to be supplied from gas or coal or nuclear and none of those sources can  compete with oil's utility to make things move! Remove oil and most motion of goods in trade, in transportation will grind to a halt. Will every car and truck and plane stop flying in 2031? Of course not. Hill's work is directed at field and reservoir depletion and at extraction, production and distribution of the so called marginal barrel, the next barrel. There will still be oil in those legacy fields being drawn to the surface and distributed but in ever diminishing amounts. If society could wake up and go on a crash program to conserve what oil exergy remains to smooth out the transition to a carbon constrained future, we could find as a society a way to safely ride the backside of Hubbert's curve and stretch out what is left but I see no reason to be optimistic that  the United states with 5 % of the world's population who consume 25% of the world's oil is showing any inclination to even consider changing its energy wasteful lifestyle  of suburban sprawl and happy motoring. The leaders of the new administration are embarking on a clueless pursuit of trying to recapture a period in US history that was fostered by almost unlimited cheap fossil energy to make America great again? The clock is running down on the oil age and whether it happens as soon as 2031 or a decade or so later, is irrelevant. This fossil energy that has provided vast wealth, enormous exponential population growth, exponential food production, easy cheap mobility and wasteful extravagance and complexity is starting to run down but our business model at least in the US and developed economies with its dependence upon oil energy is kaput or soon to be. We will simply have to switch to non oil energy sources and use far less energy to boot, and  very soon if BH Hill is right.


Sunday, January 22, 2017

The End of Oil Part 6


Today was a big day for this blog because I finally have found a reference to the work of the Hills Group and their Etp model in a linked post on the automaticearth.com written by Alastair Crooke: https://www.theautomaticearth.com/2017/01/what-is-this-crisis-of-modernity. That post is worth a read and contains a lot of good opinion on aspects of society not involving the declining net energy to society as a result of oil depletion which is of course the subject of the Hills Group 65 page monograph which I have been referencing in my latest series of blogs. It is my hope that the work of the Hills group gets wider dissemination ASAP by people with the training and perspective to understand the methodology and significance of that 65 page paper. If their work is correct then the Industrial World is in for mammoth changes in BAU and I don’t mean in 2050 or 2100 which most of the mainstream energy agencies, oil companies and business media have been assuming. The sources for their opinion has been the work of economists and economic oil analysts, oil executives and some geologist organizations and political figures who have incorrect assumptions, biases and financial motives which have hindered and impeded answers to the questions: How much oil can we realistically expect to receive in the future and for how long and what prices can we expect to pay?. It is my well considered opinion that these people are seriously mistaken in their assumptions,predictions and projections, particularly those residing within the economics profession, which is a “social” science, composed of many “schools” of thought who have had a dismal record of prediction and their recommendations to central banks and political figures have been appalling failures by any standard. Ted Williams the famous Red Sox hitter famously said “If you don’t think too good, then don’t think too much!” It is high time to listen to true scientists from valid scientific disciplines looking at these questions from valid and established scientific perspectives from fields like physics, chemistry, thermodynamics,  energy ecology, systems analysis  and climate science. We need continuing input from economic historians and I fully expect that the economic profession will be able to evolve and understand eventually the dynamics of the situation that the world is facing in the next decade or two. Lawrence Peter once wrote:” An economist is an expert who will know tomorrow why the things he predicted yesterday didn’t happen today.” And my favorite from Mark Twain:”It ain’t what you don’t know that gets you into trouble, it’s what you know for sure that just ain’t so!.”

Saturday, January 21, 2017

The End of Oil Part 5


I n this post and in future posts I will attempt to continue to refer to  the methodology of the HillsGroup using thermodynamic principles to examine world petroleum depletion. I will try to do my best to simplify and explain concepts foreign to some readers and if I explain correctly and perhaps more simply, the interested reader might be better able to draw his/her own conclusions
      Unfortunately the Hills Group doesn’t give background and history on how their research started. That might be a worthy subject for an extended magazine article but I will try to imagine the early steps. Keep in mind these guys are engineers, not poets and what counts with engineers are numbers and data.
     In a recent lecture on Oil depletion Dr Alister Hamilton who is senior lecturer in the School of Engineering at the University of Edinburgh pulled up a graph from the book “The Limits to Growth” in which he presented a graph of how the relative resource cost of the extraction of a resource ( eg oil) changed over time as the resource headed toward depletion. The graph showed that the relative cost remained relatively fixed until about 60% of the resource was consumed. After that point the cost started to climb ever more steeply as the remaining resource was extracted. This seems intuitive. IF I were to relate this to oil I would say that the early extraction up to about 60% represented the “Cheap oil”, the easy to get oil. That is in fact how the oil business has been run. In the early days of  the Spindletop Field in East Texas all they had to do was sink a pipe and the oil shot out under its own pressure. EROEI analysis of these early days estimated the energy output received versus  the energy input was enormous, perhaps 100:1 or more. This was the case for many of the early Texas and Oklahoma fields. This was fossil energy that was virtually free. It was the same case later in the Middle East where mammoth fields like the Ghawar in Saudi Arabia produced vast gushers of oil with little energy input or trouble. But today more than 60 years after the Ghawar was discovered the worlds petroleum industry has become long in the tooth. Depletion of the early huge fields is an undeniable fact and except for the North Sea and Alaska North Slope discoveries, almost no new significant easily accessible fields have been found. There have been some significant discoveries in the deep sea and there is some hope that some big finds might await in some other regions such as Siberia and the Arctic but as yet almost all the great fields have been petering out declining at 5-8% a year.. Small oilfields decline twice as fast as big ones and HSBC Global Research in a report  issued last September (2016) entitled  "Global Oil Supply: Will mature field declines drive the next supply crunch?" stated that the typical new oilfield size 40 years ago was 500 million to a Billion barrels whereas in the past decade that has fallen to only 75 million barrels, an amount only enough to power  the world for one day! Last year the exploration success rate hit a record low of 5% and the average size was a miniscule 24 million barrels enough to supply the world for less than 8 hours!  US tight oil had been one of the few bright spots and currently is providing about 4.6 mbpd, about 5% of world supply, but there has been declining production in almost all fields due to the natural 5-8% depletion rate and low world oil prices. However, world demand continues to grow at more than 1 million bpd. The Hills Group in their paper gave the USGS  resource estimate in 2000 of as much as 4.3 Trillion barrels . The world currently is using 33 Billion barrels a year. The world’s cumulative consumption since 1859 has been 1.29 Trillion barrels. So what’s the problem? It turns out that a resources depletion state has as much to do with the efficiency and cost with which it can be produced as it does with how much is in the ground and what it can be sold for. So to look at Depletion comprehensively Hill et al emphasize that the entire production system has to be looked at, not just the volume remaining and extraction at the well head. The term they use in the paper is what quantity in the resource or the reserve meets their engineering requirement which they define as “fit to use”.   Hill further states that each succeeding barrel in a field costs more in energy terms than the previous barrel in effect yielding less energy to the end user, a mandate of the second law. I understand this to mean that in addition to oil being removed, heat energy is also being removed. The temperature of the earth increases 1 deg/F for every 70 feet. A well 7000 feet deep might have a temperature 100 degrees higher than the surface. Early on in their project they must have realized that accurate prediction needed accurate data and trying to get data on 48000 fields all over the world from small and large oil companies and oil producing countries as well as knowing the geology would be impossible. Not only was the data incomplete or inaccurate or lost, oil resource and production was often kept secret by the producers for a variety of reasons, some of which are obvious. The group decided the most reliable data set was the cumulative production produced and that data was available from energy organizations such as the EIA and the IEA. Price history was readily available as well. The Hills group chose the data set from the EIA as their starting point starting arbitrarily in 1900.   At this point I will digress temporarily to explain a bit about the energy available to be used in the petroleum producing system.
        Hill states that if crude oil is to be a useful as energy source it must be capable of delivering enough energy to support its extraction, processing and distribution. That is, oil provides the energy to produce oil.  The drilling energy used on most drilling rigs is diesel which may be used directly or by means of diesel powered generators which in turn generate electricity or power hydraulic pumps and air  compressors   and a variety of pumps to add or remove water or drilling muds for example.  Once oil appears at the well head it must be processed to remove undesirable contaminants, processed to separate the oil into component fractions and then moved to refineries to yield the various needed fractions of diesel, gasoline, asphalt and bunker fuel for ships. All this energy available to do this work is called its Exergy, which is defined as energy available to do work. Keep in mind that the energy contained in the oil is not destroyed. This is mandated by the first law of thermodynamics. The available energy to do work, its exergy is what is consumed as the oil energy is transformed into work with a large part of the energy lost to heat as entropy which always increases in irreversible processes such as these. Once the exergy has done its work, its value falls to zero. It is necessary to keep in mind that in this inefficient exergy cascade, heat is lost, “wasted” all along the way. All those diesel engines and refining and transportation engines generate entropy and waste heat and energy prodigiously. Electricity in the oil production/processing system might be coming from a coal power plant   which is 35% efficient or generated by a gasoline or diesel engine which is 20-30% efficient. Let’s not forget the  175 pound workers arriving to work in 6000  pound trucks powered by those inefficient engines, the vast majority of energy being used  to move the 6000 pound truck's mass  and  that transportation efficiency  (175/6175 lb) a paltry 2.5%!  And I almost forgot to mention that the very process of burning of the oil yields only 71% of the energy in the original crude. This is derived from the combustion equation for crude oil. That is, there are 140000 btu in a gallon of crude but after burning you are left with 99,400 btu as energy left to do work, as  crude’s Exergy or if you will, its net energy. The other 29% is wasted as heat, adding to the entropy in our world, contributing to global warming.  By now I hope the reader is getting an understanding  of the vast amount of energy flowing into the production system. The  MOST IMPORTANT POINT TO KEEP IN MIND  is that it is energy of the fossil fuels being returned as exergy to society that provides the vast majority of the wealth in our industrial civilization. Just like past civilizations, we still have slavery leveraging the work needed to be done but the slaves powering our industrial lifestyle are primarily the bond energy released from cleaving the carbon-hydrogen bonds in fossil fuels, the most important being oil. Oil Exergy to a huge extent is the portal where wealth flows into society. By this I mean of course our current fossil fuel dependent industrial society. Energy or exergy always was the driver of wealth but in the pre industrial era, that exergy came from our own backs and hands and the power of our animals whose energy came from eating plants grown by energy received from the sun. If follows then that if exergy from fossil fuels depletes, then wealth generation will also decline unless of course energy from another source can be found and substituted.    It also follows that if more and more work goes into the oil producing industry, energy is being subtracted from society. Wealth is being subtracted from society and diverted back to oil production. This means that we in society are getting poorer. The point is not far off when all the energy, the “wealth” is flowing into oil and nothing flowing back to soon to be poor little us. As Bob Dylan said “It doesn’t take a weatherman to tell you which way the wind is blowing.” It doesn’t take an economist to understand that if wealth is subtracted from an economy, the economy will contract. I think it is very possible that our recession both here and world wide is partly caused by energy and wealth being diverted back to oil production and if energy available to the world economy declines then growth will decline, or stop or become negative in the not too distant future. So is it happening as the Hills Group seems to indicate and if so when will it happen? Will we have to pay more to fill up our Landcruisers here in Jackson Hole?  Will all the central bank officials, bankers and hedge fund managers still be coming here every summer to strategize how to keep money flowing from the periphery of society into the financial globalized elites? Stay tuned as I continue to try to unpack this little known and very complicated problem.
                                                                                                                                                         

The End of Oil Part 4


     In this post I will attempt to introduce the ground breaking methodology of the Hills Group who are a group of mining engineers and project managers who published a paper in December 2013 entitled “Depletion: A Determination for the world’s petroleum reserve: an exergy analysis employing the Etp model.” A second version was issued in March 2015  as an update with extensive graphs, data sets and equations explaining their methodology and that is the version I will refer to.  This report can be obtained as a 65 page monograph from their website.I believe their work is a uniquely original Nobel Prize quality effort to look at oil production and depletion from an entirely new perspective far superior to the work previously performed by economists, oil executives and corporations, energy organizations and journalists , analysts and geologists. The traditional approach has involved cataloging oil resources and reserves worldwide with production history and estimates of future supply and demand. Their metrics have included cost, volumetric and quantitative considerations primarily. Interestingly, depletion of world energy supplies has been to date a lesser consideration. Some analysts have looked at the energy side of things employing concepts  like EROEI, that is energy return on energy invested  stating an obvious point that to obtain energy, you will need to expend energy.  But to my knowledge no one has looked at oil production, processing and distribution from a strictly energy and cost analysis perspective attempting to show energy flows into the petroleum industry and energy flows into our industrial society.     Energy flows are exceedingly important in all manner of fields from ecology, astrophysics, meteorology, and economics and as it happens oil production. The Hills Group went outside the envelope and decided to use physics and thermodynamics to see if depletion could be estimated more accurately than previous methods.  They also wanted to look at how the energy flows might influence and predict cost and availability of oil going forward. It’s my guess that when they started their work developing their hypotheses they had no idea what they would find and the impact of their conclusions.  I should say at the outset that their report is highly detailed and complex employing a myriad of equations, graphs, and data sets and the serious reader  will need at least a college level understanding of physics, mathematics and calculus to truly understand their approach.  I have that background but found that I had to go back and refresh long forgotten concepts of thermodynamics to plow through the paper which I have read and reread. What I find extraordinary is that I have not seen any peer reviews or criticism of their work anywhere outside of a few excellent energy bloggers and YouTube videos. The silence has been deafening and I continue to scan the Net for commentary on their work. If necessary I will contact energy analysts with whom I am acquainted urging them to study the work of the Hills Group and see if they can spot flaws in their reasoning. My understanding is rudimentary at best but so far I find their conclusions largely accurate but I would urge caution totally accepting their grim conclusions without additional study and research. I have a few quibbles with some of their work. For example they use physics notation which clutters their rather crude graphs. Their explanations involving thermodynamic principles could be improved and their use of for example the BTU as their preferred unit of energy seems inappropriate given that the Joule is in most respects the more standard and useful metric. I have redrawn many of their graphs to improve readability for myself. They don’t state in their paper that energy consumption by the petroleum production system should be the energy of the marginal barrel although that is implied in their work. They also seem reluctant to address the greater implications of what their work might mean to an energy dependent Industrial civilization which could be profound to say the least. I have little doubt they are unaware of the impact of their preliminary conclusions. Their work by my understanding seems to predict the imminent demise of the International Oil companies. They don’t say that oil production will cease. They just say that when the energy cost of oil extraction matches the energy delivered that oil production could cease. They don’t mention that oil production could continue if subsidized by another energy source. There are some uses of oil that have no realistic substitutes. They also didn’t emphasize the overweening importance of oil energy to the rest of the worldwide energy infrastructure. For example The BP report of 2016 states that oil as a primary energy source supplies 32.9% of the world’s primary energy but the fact is that oil underpins and subsidizes to a huge extent the production from all the other energy sources. Most importantly for the world industrial economy, oil is the driving force of everything that moves and without oil, almost nothing would move, no trucks would deliver goods, few mines would function, industrial food production would cease and the automobile transportation system would largely collapse. These possible scenarios are whoppers. Now I’ve saved the worst for last. The Hills Group shows their Etp curve hitting a wall as early as 2030 or 2031! More on that conclusion in a future post after I have tried to describe in detail the methodology of their work. I will also address policy implications for the economy and society in general and my native Jackson Hole region in particular.